Engineering Reliability Statistical Models
Engineering Statistics and Probability Knowledge
There are many standard statistical distributions which may be used to model the various engineering and reliability parameters. It has been found that a relatively small number of statistical distributions satisfies most needs in engineering and reliability work. The particular distribution used depends upon the nature of the data, in each case.
The following are some of the distributions most commonly used in engineering and reliability analysis, criteria for their use, and examples of application. The tables below, Table A and B are summaries of the shape of common failure density, reliability, and hazard rate functions for the distributions described.
| Type of Distribution | Probability Density Function, f(t) |
| Exponential | 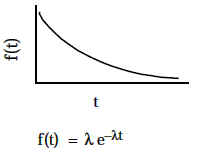 |
| Gamma | 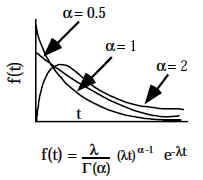 |
| Lognormal | 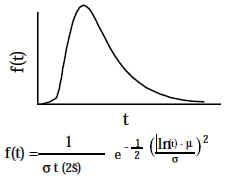 |
| Normal | 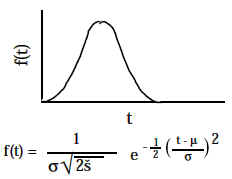 |
| Weibull | 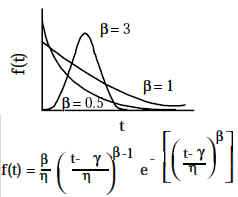 |
| Table A | |
| Type of Distribution |
Reliability Function R(t) = 1 - f(t) |
| Exponential | 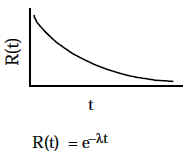 |
| Gamma | 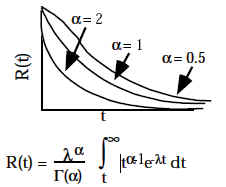 |
| Lognormal | 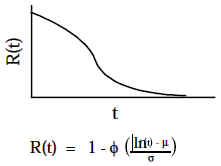 |
| Normal | 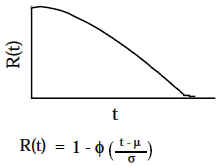 |
| Weibull | 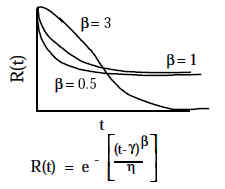 |
| Type of Distribution |
Hazard Function |
| Exponential | 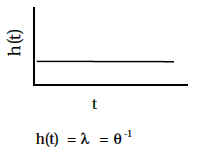 |
| Gamma | 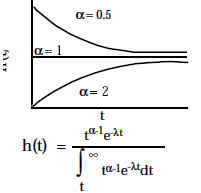 |
| Lognormal | 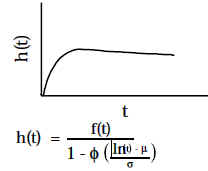 |
| Normal | 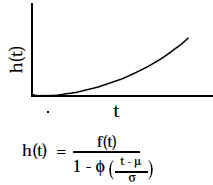 |
| Weibull | 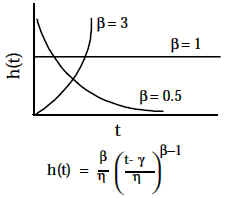 |

|
Type of Distribution |
Parameters |
| Binomial | 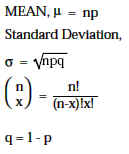 |
|
Sample data used to plot charts shown |
|
| Poisson | 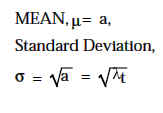 |
| Sample data used to plot charts shown |
|
Type of Distribution |
Probability of Density Function f(x) |
| Binomial | 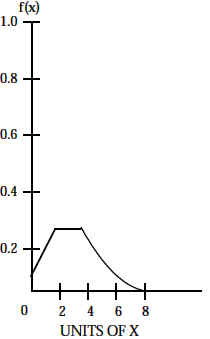 |
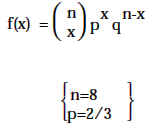 |
|
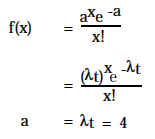
| Poisson | 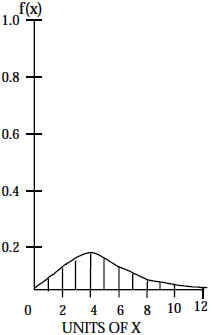 |
 |
|
Type of Distribution |
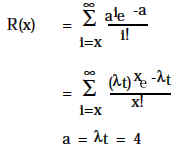
Reliability Function R(x) = 1-F(t) |
| Binomial | 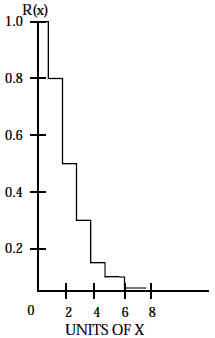 |
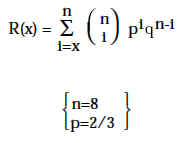 |
|
| Poisson | 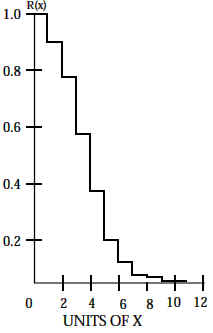 |
 |